Geospatial Modeling’s Impact on Economy: Studies and Applications
Geospatial modeling represents one of the most transformative technologies reshaping how economists, environmental scientists, and policymakers understand the intricate relationships between human economies and natural systems. By integrating satellite imagery, geographic information systems (GIS), remote sensing data, and advanced computational algorithms, geospatial modeling enables unprecedented insights into land use patterns, resource distribution, ecosystem services valuation, and economic productivity across regions and continents. This convergence of spatial technology and economic analysis has fundamentally altered our capacity to measure, predict, and optimize the economic value embedded within environmental systems.
The emergence of geospatial modeling as an economic tool reflects a broader recognition that traditional economic metrics often fail to capture the true value of natural capital and ecosystem services. When governments and corporations ignore spatial data about environmental degradation, they systematically underestimate the long-term economic costs of resource depletion and ecological collapse. Conversely, geospatial analysis reveals hidden economic opportunities in conservation, sustainable agriculture, renewable energy infrastructure, and ecosystem restoration that conventional financial models routinely overlook. This article examines the empirical evidence demonstrating how geospatial modeling reshapes economic decision-making, drives innovation in resource management, and quantifies the economic stakes of environmental change.
Understanding Geospatial Modeling in Economic Analysis
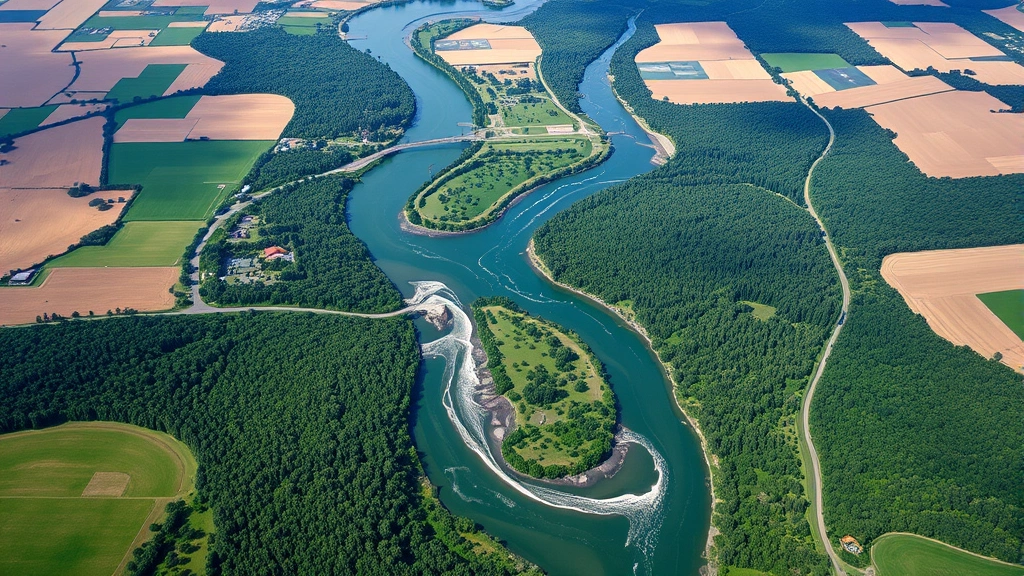
Geospatial modeling integrates multiple data layers—including satellite imagery, elevation models, climate variables, demographic information, and infrastructure networks—into coherent spatial frameworks that reveal economic patterns invisible to traditional analysis. Unlike conventional economic datasets that aggregate information at national, regional, or sectoral levels, geospatial approaches preserve spatial heterogeneity, allowing economists to identify microspatial variations in productivity, vulnerability, and opportunity. A coffee farm in Colombia’s Andean region, for instance, experiences fundamentally different climate conditions, soil quality, market access, and pest pressures than one located in lowland areas, differences that satellite-based soil mapping and climate modeling can quantify with remarkable precision.
The economic significance of this spatial granularity becomes apparent when considering resource allocation decisions. A government planning infrastructure investments across a large territory cannot optimize efficiently without understanding the spatial distribution of population, economic activity, natural hazards, and environmental constraints. Geospatial modeling provides this understanding by layering demographic data, nighttime lights satellite imagery (a proxy for economic activity), transportation networks, and hazard maps into integrated models that reveal optimal locations for schools, hospitals, roads, and industrial zones. Economic and environmental analysis increasingly relies on these spatial frameworks to balance growth objectives with ecological preservation.
Remote sensing technology—the foundation of modern geospatial modeling—captures electromagnetic radiation reflected from Earth’s surface across multiple wavelengths. Different land cover types (forests, agriculture, urban areas, water bodies) exhibit distinct spectral signatures that machine learning algorithms can classify with high accuracy. These classifications, updated monthly or even weekly by modern satellite constellations, create dynamic maps of land-use change that economists use to track deforestation rates, urban expansion, agricultural intensification, and infrastructure development. Studies using Landsat, Sentinel, and commercial satellite data have documented that spatial monitoring reduces information asymmetries between environmental regulators and resource users, fundamentally altering the economics of environmental enforcement and compliance.
Quantifying Natural Capital Through Spatial Data
One of geospatial modeling’s most consequential economic applications involves quantifying natural capital—the stock of environmental assets including forests, wetlands, fisheries, mineral deposits, and soil quality. Traditional national accounting systems, which calculate GDP and measure economic growth, typically treat natural capital extraction as income rather than asset depletion. A country harvesting timber at unsustainable rates appears economically prosperous in GDP terms, even as its forest wealth diminishes. Geospatial modeling enables natural capital accounting by spatially mapping these assets and monitoring their changes across time.
The World Bank’s Genuine Progress Indicator work extensively employs geospatial data to adjust national income accounts for natural resource depletion and environmental degradation. By integrating satellite-derived forest cover maps with economic valuation models, researchers can calculate the annual economic loss from deforestation in monetary terms comparable to GDP components. Indonesia’s forests, for example, contain enormous carbon stocks and biodiversity value; satellite monitoring reveals that deforestation rates correlate with specific economic activities (palm oil expansion, logging, agriculture), enabling economists to calculate the true economic cost of these activities when environmental externalities are internalized.
Soil quality represents another critical natural capital dimension that geospatial modeling quantifies economically. Spectral analysis of satellite imagery, combined with ground-truthing through field sampling, maps soil organic matter content, nutrient availability, and erosion vulnerability across agricultural regions. These spatial soil maps enable economists to model agricultural productivity under different management scenarios and calculate the economic value of soil conservation practices. Research in sub-Saharan Africa demonstrates that geospatial soil mapping reveals localized opportunities for soil improvement investments with returns exceeding 100% annually—investments that remain invisible without spatial analysis of soil heterogeneity.
Water resources valuation similarly benefits from geospatial approaches. Satellite-based measurements of soil moisture, vegetation water stress, groundwater depletion (detected through gravity anomalies), and surface water extent provide economists with unprecedented detail about water availability and scarcity. Integrating these spatial water datasets with economic models of agricultural production, industrial demand, and household consumption enables calculation of water’s true economic value—often dramatically higher than market prices suggest, particularly in water-stressed regions where geospatial analysis reveals hidden competition for limited supplies.
” alt=”satellite-earth-observation-agricultural-fields”>
Agricultural Economics and Land-Use Optimization
Agriculture’s economic contribution extends far beyond crop production value; it encompasses employment, food security, rural development, and ecosystem service provision. Geospatial modeling transforms agricultural economics by enabling precision analysis of productivity variations, input optimization, and sustainability trade-offs across landscapes. Understanding human-environment interaction in agricultural systems requires spatial perspectives that reveal how farming practices in one location cascade through watersheds and ecosystems to affect productivity and profitability elsewhere.
Yield mapping technologies, which combine satellite imagery with crop modeling and field-level yield data, reveal that productivity varies dramatically within individual fields due to spatial variations in soil properties, topography, and microclimate. Geospatial analysis quantifies these variations and identifies economically optimal input applications for different field zones. Farmers using geospatial-guided variable-rate fertilizer application reduce input costs by 15-25% while maintaining or increasing yields—a direct economic benefit that geospatial modeling makes possible. At regional scales, similar analysis identifies which land areas should remain in agriculture versus be restored to natural vegetation based on comparative economic advantage and environmental suitability.
Climate-smart agriculture investments increasingly rely on geospatial modeling to identify optimal locations and practices. Satellite-derived climate data, soil maps, and crop suitability models enable economists to calculate expected returns from conservation agriculture, agroforestry, or crop diversification across specific locations. Research in East Africa demonstrates that geospatial modeling identifies microspatial pockets where drought-tolerant crop varieties or water harvesting investments deliver exceptional economic returns—returns that aggregate to substantial regional impacts when targeted through spatially explicit analysis rather than uniform policy approaches.
Land-use change economics fundamentally depends on geospatial monitoring. When farmers convert forest to agriculture or vice versa, they respond to perceived economic incentives; however, these incentives often ignore environmental externalities and spatial ecosystem service flows. Geospatial models that map carbon storage, water filtration, biodiversity habitat, and other ecosystem services across landscapes enable economists to calculate the true opportunity cost of land-use conversion. Studies integrating satellite forest cover maps with ecosystem service valuation models reveal that forest conservation often delivers greater net economic value than conversion to agriculture when all ecosystem services are monetized—insights that geospatial analysis makes quantifiable and spatially explicit.
Urban Economics and Infrastructure Planning
Urban areas concentrate economic activity, generate substantial GDP, and drive employment and innovation; yet urban planning often proceeds with inadequate information about spatial economic patterns and environmental constraints. Geospatial modeling revolutionizes urban economics by revealing the economic geography of cities—where people live, work, consume, and generate waste—with granularity that enables optimized infrastructure planning and service delivery.
Nighttime lights satellite imagery provides a continuous, objective measure of economic activity distribution across urban areas. This data reveals that economic activity concentrates in specific zones (downtown business districts, industrial areas, commercial corridors) while other urban areas remain economically marginal. Economists use these spatial patterns to identify underperforming neighborhoods, predict future growth trajectories, and optimize public investment allocation. A city planning bus rapid transit corridors, for instance, can use geospatial analysis of population distribution, employment centers, and current travel patterns to design routes maximizing ridership and economic efficiency far better than conventional planning approaches.
Real estate economics benefits substantially from geospatial analysis. Property values correlate with numerous spatial factors: proximity to employment centers, quality of schools and services, environmental amenities, hazard exposure, and accessibility. Geospatial models that integrate these spatial variables enable more accurate property valuation, reveal spatial market segmentation, and identify investment opportunities. Urban economists increasingly use hedonic pricing models—which statistically relate property prices to spatial characteristics—to quantify the economic value of environmental amenities (parks, water views, air quality) and dis-amenities (pollution, flood risk, noise).
Reducing urban carbon footprints requires understanding spatial patterns of emissions, energy consumption, and transportation choices. Geospatial modeling of building energy use (estimated from satellite thermal imagery and building characteristics), transportation networks, and renewable energy potential enables cities to design decarbonization strategies with spatial precision. A city might identify neighborhoods where rooftop solar deployment delivers exceptional returns, or districts where district heating systems could economically replace individual building furnaces—identifications that geospatial analysis enables but conventional data cannot support.
Climate Change Economics and Spatial Risk Assessment
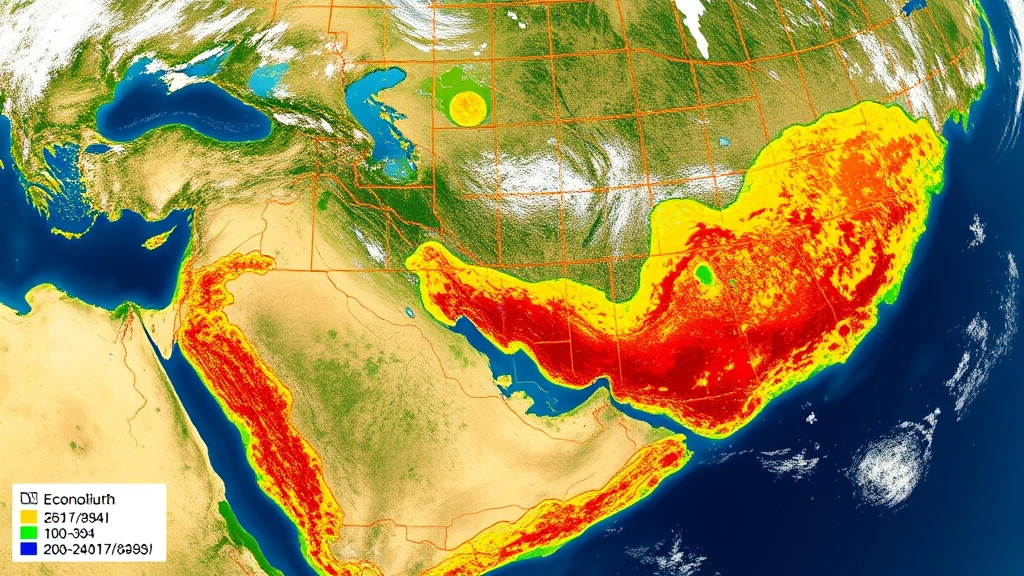
Climate change economics traditionally emphasizes aggregate global impacts, yet climate change impacts vary dramatically across space—some regions experience increased precipitation while others face severe drought; some areas benefit from extended growing seasons while others suffer crop failure from heat stress. Geospatial modeling enables economists to map these spatially heterogeneous climate impacts and calculate location-specific economic consequences with unprecedented precision.
Downscaled climate models combine global climate projections with high-resolution topographic and land-use data to generate spatially explicit climate scenarios at grid resolutions of 1 kilometer or finer. These spatial climate projections drive economic impact models for agriculture, water resources, energy demand, and ecosystem services. Research integrating downscaled climate models with agricultural production functions reveals that climate change impacts vary from severe damage in some regions to modest benefits in others—a spatial heterogeneity that aggregate global impact estimates completely obscure. Economists can thus identify which regions face greatest climate vulnerability and require adaptation investment, and which regions possess comparative advantages under future climate conditions.
Disaster risk economics increasingly relies on geospatial modeling to quantify economic exposure to climate-related hazards. Flood risk models integrate high-resolution topographic data with rainfall projections and river network models to map flood hazard zones with remarkable spatial precision. Overlaying these hazard maps with economic data (property values, infrastructure location, industrial facilities) reveals total economic exposure to flood risk. Similar approaches apply to hurricane risk, drought risk, and other climate hazards. Insurance companies and financial institutions increasingly use these geospatial risk models to price climate risk and allocate capital—creating economic incentives for risk reduction investments identified through spatial analysis.
Ecosystem service impacts of climate change, mapped through geospatial modeling, reveal economic consequences often overlooked in conventional climate impact assessments. Forest productivity models driven by downscaled climate projections reveal that timber values will shift geographically—some regions becoming unsuitable for current forest types while others gain suitability. Carbon storage capacity of forests changes with climate, affecting the economic value of forest carbon credits. Pollination services, water availability, and disease vectors all shift geographically with climate, creating spatially heterogeneous economic impacts that geospatial modeling quantifies. UNEP research extensively employs these geospatial approaches to assess climate adaptation needs and prioritize investments across regions.
Biodiversity Valuation and Ecosystem Services Markets
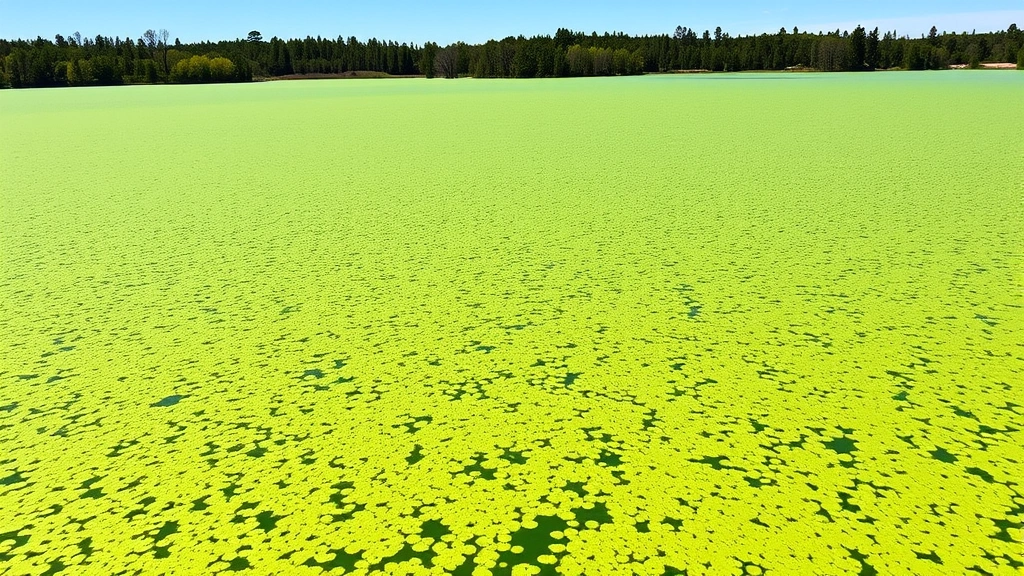
Biodiversity represents an economic asset that markets routinely undervalue or ignore entirely. Geospatial modeling enables economists to map biodiversity patterns and calculate economic values that markets fail to recognize, creating opportunities for conservation finance and ecosystem service markets. Satellite-derived vegetation indices, land-cover classifications, and species distribution models combine to map biodiversity hotspots—areas of exceptional species richness and endemism that warrant conservation priority and investment.
Sustainable economic activities increasingly recognize ecosystem service values; geospatial modeling quantifies these values spatially. Pollination services, provided by wild bees and other insects, depend on habitat quality and proximity to agricultural lands. Geospatial models mapping habitat quality, landscape connectivity, and agricultural land-use patterns enable economists to calculate pollination service values and identify where habitat restoration delivers exceptional economic returns. Similarly, water purification services provided by wetlands and forests can be valued through geospatial analysis of water flow patterns, contamination sources, and treatment cost alternatives.
Payment for ecosystem services (PES) schemes increasingly employ geospatial modeling to target conservation investments efficiently. Rather than paying uniform per-hectare amounts for conservation, spatially explicit PES schemes use geospatial analysis to identify locations where conservation delivers greatest ecosystem service benefits per dollar invested. Research in Costa Rica, Indonesia, and other biodiversity hotspots demonstrates that geospatially targeted PES delivers substantially greater conservation outcomes and ecosystem service benefits than spatially uniform approaches—a compelling economic argument for spatial precision in conservation finance.
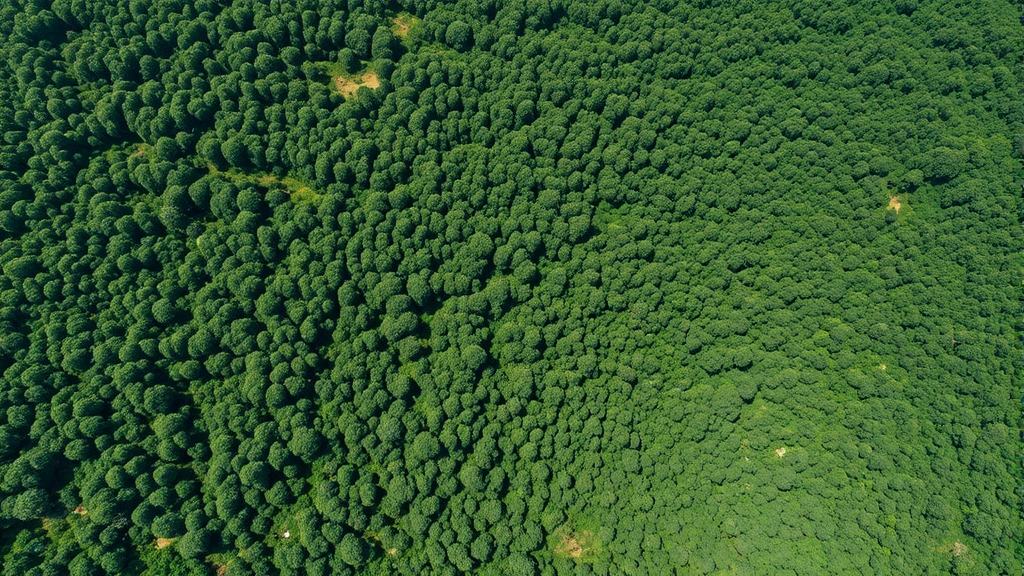
Carbon markets represent the most developed ecosystem service market, and geospatial modeling fundamentally shapes their functioning. Forest carbon projects calculate carbon stock changes through satellite forest cover monitoring combined with biomass models; these geospatial approaches enable monitoring, reporting, and verification (MRV) of carbon credits at scales and costs that ground-based monitoring cannot match. Ecosystem service valuation research increasingly emphasizes spatial heterogeneity in service provision and argues for geospatially explicit payment mechanisms that reward locations delivering greatest benefits.

” alt=”biodiversity-forest-ecosystem-landscape-monitoring”>
Implementation Challenges and Data Governance
Despite extraordinary potential, geospatial modeling’s integration into economic decision-making faces substantial challenges. Data accessibility, technical capacity, computational resources, and institutional coordination barriers all slow adoption of spatially explicit economic approaches. Many developing countries lack the technical expertise, computational infrastructure, and institutional frameworks necessary to implement sophisticated geospatial modeling. International organizations and technology providers increasingly support capacity building, yet disparities in geospatial analytical capacity between wealthy and developing nations persist.
Data quality and validation present ongoing challenges. Satellite imagery, while increasingly available and affordable, contains errors from cloud cover, atmospheric distortion, and classification uncertainty. Ground-truthing—field verification of remotely sensed classifications—remains expensive and labor-intensive. Integrating satellite data with economic datasets (farm-level income, firm-level production, household expenditure) requires careful matching of spatial and temporal resolution, yet such integration remains technically complex. Privacy concerns also emerge when detailed geospatial economic data enables identification of individual properties, firms, or households, raising governance questions about appropriate data access and use.
Institutional coordination challenges arise because geospatial modeling requires integration of data and expertise from multiple sectors (agriculture, forestry, water resources, urban planning, energy) that often operate independently. Creating institutional frameworks for data sharing, coordinated analysis, and joint decision-making requires overcoming bureaucratic silos and establishing clear governance arrangements. The World Bank’s governance initiatives increasingly emphasize spatial data integration as essential for development planning, yet implementation remains inconsistent across countries and sectors.
Methodological questions persist regarding appropriate economic valuation of spatially heterogeneous ecosystem services and natural capital. Should ecosystem services be valued using market prices, replacement cost approaches, or contingent valuation methods? How should economists account for spatial interactions and spillovers when valuing services in specific locations? These questions involve both technical and normative dimensions; geospatial modeling provides unprecedented capacity to measure spatial patterns, yet economic interpretation requires careful consideration of underlying assumptions and value judgments.
Emerging technologies promise to overcome some implementation challenges. Machine learning approaches increasingly enable automated analysis of massive geospatial datasets, reducing manual classification labor. Cloud computing platforms make sophisticated geospatial analysis accessible without requiring local computational infrastructure. Open-source geospatial software and freely available satellite imagery (Landsat, Sentinel) reduce barriers to entry. As these technologies mature and diffuse, geospatial modeling’s integration into economic decision-making should accelerate, though capacity disparities between wealthy and developing nations may persist without intentional technology transfer and capacity building.
FAQ
How does geospatial modeling differ from traditional economic analysis?
Traditional economic analysis typically aggregates data at national, regional, or sectoral levels, losing spatial detail about how economic activity and environmental conditions vary across locations. Geospatial modeling preserves spatial heterogeneity, enabling economists to identify microspatial variations in productivity, vulnerability, and opportunity that aggregate analysis obscures. This spatial precision enables optimized resource allocation, targeted investment, and more accurate economic valuation of environmental assets and hazards.
What data sources support geospatial economic modeling?
Satellite imagery (optical and radar), elevation models, climate data, demographic information, infrastructure networks, and economic datasets combine to create geospatial economic models. Modern satellite constellations provide frequent, high-resolution imagery; climate models provide spatially explicit projections; census and household survey data provide demographic information. Integrating these diverse data sources requires technical expertise but increasingly feasible through cloud computing platforms and open-source software.
How accurate are geospatial models for economic decision-making?
Accuracy varies depending on data quality, model design, and application context. Satellite-derived land-cover classifications typically achieve 85-95% accuracy; crop yield predictions based on geospatial data correlate with observed yields at r-squared values of 0.7-0.9; climate projections contain uncertainty ranges reflecting model differences and natural variability. Despite limitations, geospatial models typically outperform alternatives lacking spatial information, and uncertainty quantification enables risk-aware decision-making.
Can geospatial modeling help developing countries with limited technical capacity?
Renewable energy planning and other development priorities increasingly benefit from cloud-based geospatial platforms requiring minimal local technical capacity. International organizations provide training and support; open-source software reduces licensing costs; freely available satellite data eliminates expensive data acquisition. However, sustained capacity building remains essential, as does institutional development to translate geospatial analysis into policy and practice.
How does geospatial modeling address environmental equity concerns?
Geospatial modeling reveals spatial patterns of environmental hazard exposure, ecosystem service benefits, and economic opportunity that often correlate with socioeconomic status. By mapping these patterns explicitly, geospatial analysis can identify environmental injustices—such as low-income communities disproportionately exposed to pollution or excluded from ecosystem service benefits—enabling targeted policy responses. However, geospatial analysis itself is technically neutral; addressing environmental equity requires deliberate policy choices informed by spatial data.
What role will artificial intelligence play in geospatial economic modeling?
Machine learning and deep learning approaches increasingly automate geospatial data processing, enabling analysis of massive datasets that manual classification cannot handle. Neural networks trained on satellite imagery classify land cover, detect infrastructure, and identify economic activity patterns with improving accuracy. As AI capabilities advance, geospatial modeling will become more automated, accessible, and capable of handling higher-resolution data streams—though human oversight remains essential for ensuring appropriate interpretation and application.