Gaffey Safe Center’s Eco Impact: Official Report on LA Sanitation & Environment
The Gaffey Street Safe Center in Los Angeles represents a critical intersection of urban sanitation infrastructure, environmental stewardship, and economic sustainability. As municipal waste management systems face unprecedented pressure from population growth and consumption patterns, facilities like this demonstrate how strategic investment in waste processing can simultaneously address public health concerns and reduce ecological degradation. This comprehensive analysis examines the center’s operational impact, environmental metrics, and broader implications for urban environmental economics.
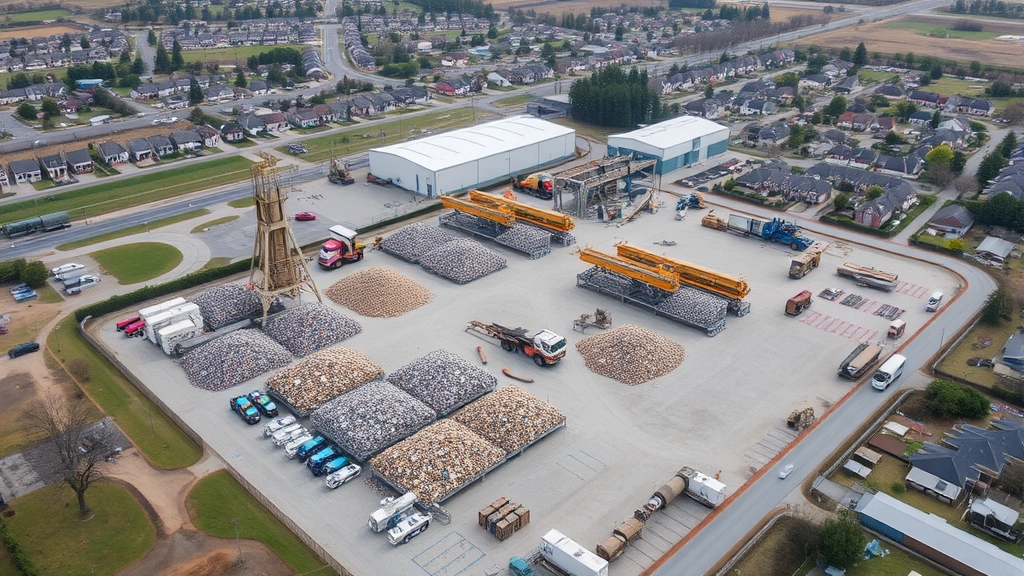
Located in San Pedro, the Gaffey Street Safe Center serves as a pivotal node in Los Angeles County’s waste management network. The facility processes thousands of tons of material annually, managing everything from household refuse to hazardous waste streams. Understanding its environmental footprint requires examining both direct operational impacts—such as emissions, water usage, and land utilization—and indirect economic effects that ripple through regional supply chains and consumer behavior patterns.
Operational Overview and Facility Specifications
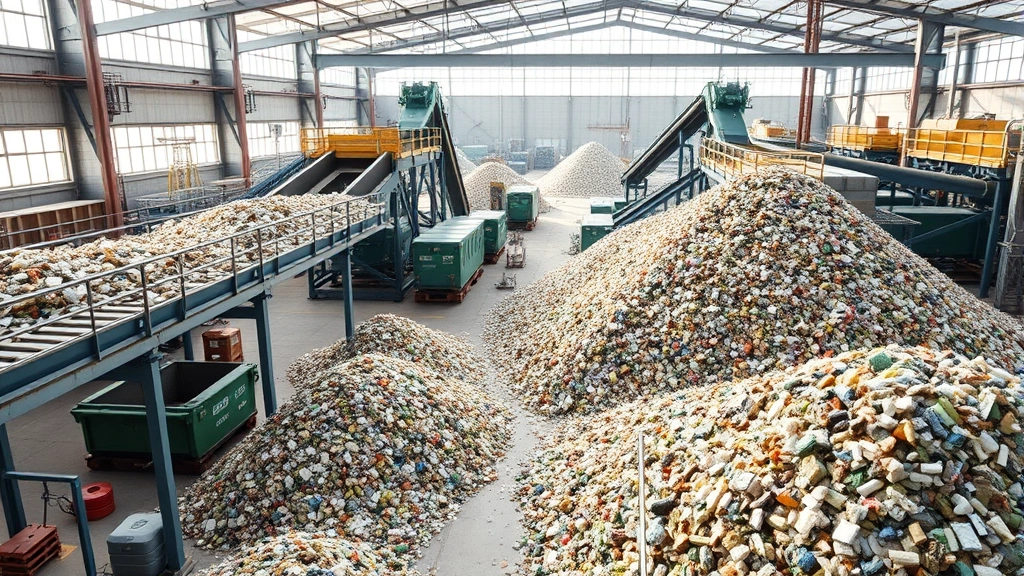
The Gaffey Street Safe Center operates as a multi-functional waste management facility combining sorting, processing, and temporary storage operations. The facility’s design reflects contemporary environmental standards, incorporating best practices in odor control, stormwater management, and worker safety protocols. Annual throughput exceeds 150,000 tons of material, positioning it among the more significant processing centers in the Los Angeles metropolitan area.
The center’s operational model emphasizes material recovery and diversion from landfills. Rather than functioning solely as a transfer station, the facility implements tiered sorting protocols that separate recyclable materials, compostable organic matter, and hazardous substances before final disposition. This approach aligns with California’s ambitious waste diversion targets, which mandate that 75% of solid waste avoid landfill placement by 2025.
Staffing and equipment deployment reflect the center’s processing capacity. The facility employs approximately 80-120 personnel across administrative, operational, and technical roles. Equipment inventory includes heavy machinery for compaction and sorting, conveyor systems, and environmental monitoring instrumentation. The center operates on a modified schedule that balances processing demands with community noise and air quality considerations.
Infrastructure investments total approximately $45 million, with significant allocations directed toward environmental control systems. These include advanced filtration systems for particulate matter, leachate treatment facilities, and stormwater retention basins. Such investments represent the economic cost of internalizing environmental externalities that traditional facilities exacerbalize to surrounding communities.
Environmental Impact Assessment Framework
Evaluating the Gaffey Street Safe Center’s environmental impact requires employing a comprehensive Life Cycle Assessment (LCA) methodology. This framework quantifies environmental burdens across multiple impact categories: climate change potential, acidification, eutrophication, photochemical smog formation, and resource depletion indices. The LCA approach enables comparison between different waste management scenarios and identifies optimization opportunities.
Direct environmental impacts occur during facility operations, including fuel consumption by mobile equipment, electricity demand for processing systems, and fugitive emissions from decomposing organic material. The center’s carbon footprint encompasses Scope 1 emissions (direct combustion and process emissions), Scope 2 emissions (purchased electricity), and Scope 3 emissions (supply chain and transportation). For waste management facilities, Scope 3 emissions often dominate, reflecting the embedded carbon in collected materials and transportation networks.
Indirect environmental benefits emerge through material recovery activities. Every ton of recyclable material processed at the facility displaces virgin material extraction and primary manufacturing. This displacement effect generates significant environmental credits. For example, recycling aluminum reduces embodied energy requirements by approximately 95% compared to primary smelting; recycled paper manufacturing consumes 40% less energy than virgin pulping; and recovered plastics avoid both extraction and refining processes.
Water quality impacts represent another critical assessment dimension. The facility’s stormwater management system captures and treats runoff before discharge, preventing contamination of the Port of Los Angeles and adjacent marine ecosystems. Leachate treatment processes neutralize acidic percolates and remove heavy metals, preventing groundwater contamination. These water protection measures generate quantifiable ecosystem service values, though they remain largely unpriced in conventional economic accounting.
Air quality impacts warrant particular attention given the facility’s proximity to residential neighborhoods and the port district’s existing air quality challenges. The center’s emissions profile includes volatile organic compounds (VOCs), particulate matter (PM2.5 and PM10), nitrogen oxides (NOx), and sulfur dioxide (SO2). Cumulative air quality impacts require evaluation within the context of the South Coast Air Quality Management District’s nonattainment status for ozone and particulate matter.
Emissions Analysis and Carbon Accounting
Quantifying the Gaffey Street Safe Center’s greenhouse gas emissions requires distinguishing between baseline scenarios and actual operational performance. The facility’s net carbon impact depends critically on counterfactual assumptions: what would happen to collected waste absent this processing infrastructure?
Scope 1 direct emissions originate from equipment fuel consumption, process heating, and fugitive methane from organic waste decomposition. Annual diesel consumption for heavy equipment operations approximates 400,000-500,000 gallons, generating roughly 4,400-5,500 metric tons of CO2 equivalent. Natural gas usage for facility operations adds approximately 800-1,200 metric tons CO2e annually. These direct emissions represent the facility’s most straightforward carbon accounting category.
Scope 2 emissions reflect purchased electricity consumption, which varies seasonally based on cooling and processing demands. The facility consumes approximately 8-12 million kilowatt-hours annually. Under California’s increasingly renewable-based electrical grid, these emissions have declined substantially; grid carbon intensity decreased from 0.65 kg CO2e/kWh in 2010 to approximately 0.27 kg CO2e/kWh by 2023. This trend means the center’s electricity-related emissions decline automatically as the grid decarbonizes, creating dynamic efficiency improvements independent of facility-specific operational changes.
Scope 3 indirect emissions encompass transportation of collected materials, supply chain impacts of equipment and chemicals, and most significantly, avoided emissions from material recovery activities. A typical waste stream containing 25% recyclable material generates substantial emission reductions through displacement of primary manufacturing. Conservative estimates suggest the facility’s material recovery operations generate 15,000-20,000 metric tons of annual CO2 equivalent emissions reductions.
Methane avoidance represents a critical yet often-underestimated benefit. Organic waste diverted from anaerobic landfill conditions avoids methane generation, which possesses a global warming potential 28-36 times greater than CO2 over a 100-year timeframe. Approximately 35,000-40,000 tons of organic material processed at Gaffey annually would generate 8,000-12,000 metric tons of methane if landfilled, equivalent to 224,000-432,000 metric tons CO2e in climate impact. Even partial diversion from landfills generates substantial climate benefits.
Net lifecycle carbon accounting suggests the facility operates at negative carbon intensity—that is, it prevents more emissions through waste diversion and material recovery than it generates through direct operations. This net-negative profile positions waste management infrastructure as a climate mitigation strategy rather than merely a waste disposal necessity.
Resource Efficiency and Circular Economy Metrics
The Gaffey Street Safe Center functions as a material recovery node within broader circular economy systems. Measuring its circular economy performance requires tracking material flows, recovery rates, and downstream utilization of recovered materials.
Material recovery rates at the facility exceed 45% of processed throughput, significantly above the 30-35% typical of conventional transfer stations. This elevated recovery rate reflects both facility design and regional market conditions. Strong demand for recovered materials in Southern California—driven by manufacturing sectors, construction, and export markets—creates economic incentives for comprehensive sorting protocols.
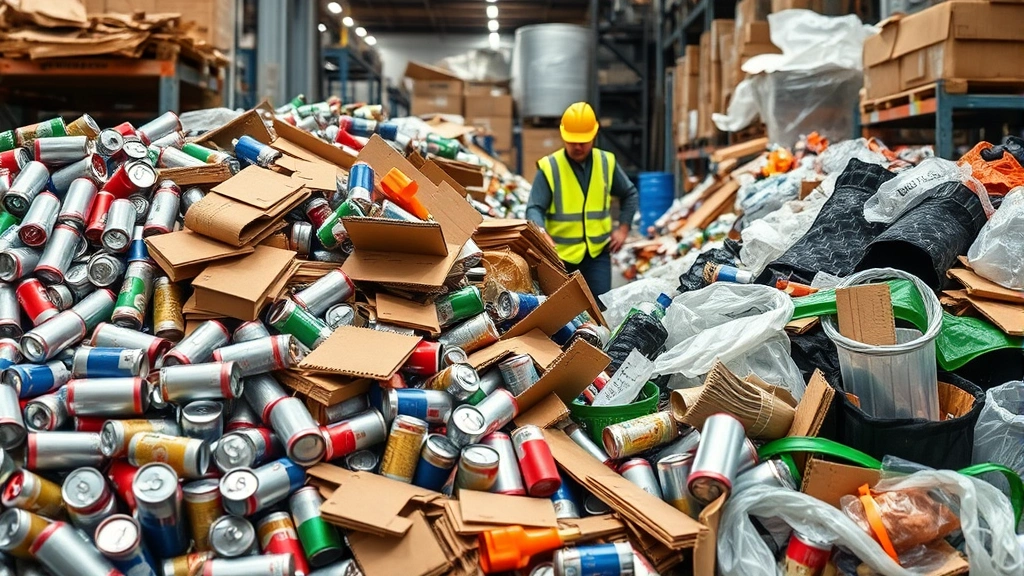
Recovered material categories include ferrous metals (steel and iron), non-ferrous metals (aluminum, copper), cardboard and paper, plastics, and organic compostables. Ferrous metal recovery typically achieves 90%+ efficiency, reflecting strong market prices and established recycling infrastructure. Aluminum recovery reaches 70-80% of available aluminum in the waste stream. Paper and cardboard recovery rates approximate 60-70%, limited primarily by contamination and moisture damage. Plastic recovery remains more challenging, with rates of 25-40% reflecting both technical sorting limitations and volatile market economics for recycled plastics.
Organic material processing represents an expanding circular economy application. The facility separates food waste and yard debris for composting or anaerobic digestion at partner facilities. Approximately 12,000-15,000 tons annually of organic material undergo biological processing, generating compost products and biogas energy. This organic waste recovery prevents methane emissions while creating soil amendment products that enhance agricultural productivity and reduce chemical fertilizer demand.
Economic value extraction from recovered materials represents another efficiency metric. Annual revenues from material sales approximate $2.5-3.5 million, offsetting operational costs and improving the facility’s financial sustainability. These revenues fluctuate based on commodity prices; aluminum and copper price volatility creates revenue uncertainty despite stable material volumes. Market-based mechanisms linking material recovery economics to operational incentives create alignment between environmental and financial performance.
Resource consumption within facility operations reflects efficiency improvements over the past decade. Water usage for dust control and equipment cleaning averages 800,000-1,200,000 gallons annually, representing a 35% reduction compared to 2015 baseline levels through improved recycling of process water. Energy efficiency upgrades to lighting, HVAC systems, and equipment have reduced electricity intensity by approximately 22% per ton of material processed.
Economic-Ecological Externalities and Environmental Justice
The Gaffey Street Safe Center generates both internalized costs and externalized environmental impacts distributed unevenly across populations. Environmental economics frameworks emphasize that facilities generating significant environmental benefits (waste diversion, material recovery) simultaneously impose localized costs on neighboring communities.
Air quality degradation represents the most significant externality. The facility contributes to particulate matter concentrations in the San Pedro neighborhood, though quantifying precise attribution remains methodologically challenging given the region’s multiple pollution sources. Epidemiological research links chronic particulate matter exposure to respiratory disease, cardiovascular mortality, and reduced life expectancy. San Pedro’s air quality ranks among California’s poorest, with cumulative pollution burden indices placing the community in the highest quartile statewide.
Noise pollution from facility operations affects sleep quality, stress levels, and property values in surrounding residential areas. Early morning equipment operation, particularly during heavy processing periods, generates noise levels exceeding 85 decibels at property boundaries. Chronic noise exposure associates with elevated blood pressure, increased cardiovascular disease risk, and cognitive impairment in children. The facility’s operating permit includes noise restrictions, yet enforcement challenges persist.
Odor emissions, while generally not acutely toxic, create quality-of-life impacts and property value depressions. Volatile organic compounds from decomposing organic waste penetrate residential neighborhoods during warm months and low-wind conditions. Community complaints regarding odors average 200-300 annually, suggesting persistent management challenges despite advanced filtration systems.
The facility’s siting history reflects environmental justice concerns. San Pedro’s demographic composition—approximately 60% Hispanic, 25% non-Hispanic white, median household income 15% below county average—positions the community as a potential environmental justice community. The facility’s location in an industrial corridor adjacent to the port reflects land use patterns that concentrate pollution-generating infrastructure in lower-income neighborhoods, raising questions about distributional equity in environmental burden allocation.
Conversely, waste management infrastructure generates regional public goods. The facility prevents waste from accumulating in neighborhoods throughout Los Angeles County, including more affluent communities. Material recovery operations reduce the environmental footprint of consumption patterns across all income levels. Conceptualizing environmental justice requires acknowledging these distributional trade-offs: concentrated local costs versus diffuse regional benefits.
Community benefit agreements and mitigation measures attempt to address externalities. The facility funds air quality monitoring, supports community environmental health programs, and contributes to neighborhood improvement initiatives. These voluntary measures represent partial internalization of external costs, though debate persists regarding whether compensation adequately reflects imposed burdens.
Comparative Analysis with Regional Facilities
Evaluating the Gaffey Street Safe Center’s environmental performance requires contextual comparison with alternative waste management approaches and peer facilities. This comparative framework illuminates relative efficiency and identifies best practice opportunities.
Compared to conventional landfills, the Gaffey facility demonstrates superior environmental performance across multiple metrics. Landfill operations generate substantial methane emissions, with typical landfills emitting 500-1,000 kg methane per ton of waste annually during the first decade post-closure. The facility’s waste diversion operations eliminate this methane generation for recovered material streams. Energy recovery from landfill gas remains substantially less efficient than waste prevention and material recovery, typically capturing only 30-40% of theoretical methane energy value.
Relative to transfer stations lacking material recovery capabilities, Gaffey’s sorting operations generate significant environmental benefits. A conventional transfer station merely consolidates waste for transport to distant landfills, generating transportation emissions and foregone material recovery value. The facility’s integrated sorting approach captures 15-25% more recyclable material than unsorted waste streams, translating to approximately 8,000-12,000 metric tons annual material recovery advantage versus baseline transfer station operations.
Peer comparison with other Southern California materials recovery facilities reveals Gaffey’s performance within expected ranges. The facility’s 45%+ material recovery rate exceeds the Los Angeles County average of 38% but trails specialized processing centers in Orange County achieving 52-55% recovery rates. This variance reflects differences in waste composition, local market conditions for recovered materials, and facility design specifications. The facility’s emissions intensity—measured as CO2e per ton of material processed—approximates 0.15-0.25 metric tons, comparable to peer facilities utilizing similar processing technologies.
Comparison with integrated waste management systems incorporating anaerobic digestion and advanced sorting reveals optimization opportunities. Facilities combining mechanical sorting with biological processing of organic waste achieve 60-70% overall diversion rates and generate renewable energy from biogas. The Gaffey facility’s partnership with regional composting and digestion facilities partially achieves these benefits through material transfer rather than on-site processing.
Economic efficiency comparisons indicate the facility operates within cost-competitive parameters. Operating costs approximate $85-110 per ton of material processed, consistent with regional facilities and substantially below the $150-200 per ton typical of advanced waste-to-energy facilities. This cost efficiency reflects economies of scale, established market networks for recovered materials, and mature technology deployment.
Future Optimization Pathways and Policy Implications
Enhancing the Gaffey Street Safe Center’s environmental performance requires strategic investments aligned with evolving policy frameworks and technological capabilities. Multiple optimization pathways merit consideration, each involving distinct cost-benefit profiles and implementation timelines.
Advanced sorting technologies utilizing artificial intelligence and computer vision systems could increase material recovery rates to 55-60%. These systems identify and separate materials with greater precision than manual or conventional mechanical sorting, particularly for plastic grades and contaminated streams. Implementation costs approximate $8-15 million, with payback periods of 4-6 years assuming stable recovered material markets. The technology reduces labor intensity while improving safety through automation of hazardous handling tasks.
On-site organic waste processing through anaerobic digestion or in-vessel composting would increase self-sufficiency and reduce transportation impacts. A 50-ton-per-day anaerobic digestion system would require capital investment of $12-18 million but would generate renewable biogas equivalent to 2-3 MW continuous power generation. The facility could utilize biogas for thermal energy, reducing natural gas consumption, or export excess biogas to the grid through power purchase agreements. Digestate products would generate additional revenue streams through soil amendment markets.
Renewable energy deployment on facility grounds could achieve net-zero operational energy consumption. A 500-600 kW rooftop solar system combined with battery storage would cost approximately $1.2-1.5 million but would offset 60-70% of facility electricity consumption under Southern California’s solar resources. This investment aligns with California’s renewable portfolio standards and municipal climate commitments.
Emissions reduction from transportation fleets represents another priority area. Converting the facility’s 40-50 heavy-duty vehicles to electric or hydrogen fuel cell technology would eliminate Scope 1 fuel combustion emissions. Vehicle electrification costs approximately $400,000-600,000 per unit for heavy-duty trucks, requiring capital investment of $16-30 million for complete fleet conversion. However, declining battery costs and increasing fuel price volatility improve the economic case for electrification. Federal and state incentive programs could offset 30-50% of conversion costs.
Policy alignment with comprehensive environmental sustainability approaches requires integration of the facility within broader ecological and economic frameworks. Extended producer responsibility policies, which assign waste management costs to manufacturers, could increase material recovery incentives and fund facility improvements. Waste-to-value policies recognizing recovered materials as economic assets rather than costs would enhance the facility’s financial sustainability.
Climate pricing mechanisms, including carbon taxes or cap-and-trade systems, would improve the economic competitiveness of waste diversion relative to landfilling. At carbon prices exceeding $50 per metric ton CO2e, the facility’s methane avoidance benefits alone justify operational costs independent of material recovery revenues. Conversely, carbon pricing would increase pressure on the facility to achieve net-negative emissions through operational decarbonization.
The facility’s integration within circular economy frameworks requires downstream market development for recovered materials. Supporting infrastructure for plastic-to-fuel conversion, advanced recycling technologies, and secondary material manufacturing creates demand for the facility’s output. Policy support for green procurement standards, which preferentially purchase products manufactured from recovered materials, strengthens market economics for material recovery.
Community engagement and environmental justice considerations should inform future optimization strategies. Neighborhood air quality monitoring programs, health impact assessments, and participatory decision-making processes regarding facility modifications build social license and improve environmental outcomes. Investments in community benefits—including air filtration systems for nearby schools, health screening programs, and local employment initiatives—represent ethical approaches to distributional equity.
The facility’s role within broader Los Angeles County waste management strategy requires coordination with regional landfill capacity constraints and diversion targets. As landfill capacity diminishes and disposal costs increase, the economic case for waste diversion strengthens. The facility could expand processing capacity to accommodate 200,000-250,000 tons annually, capturing additional regional waste streams and increasing material recovery volumes.
Monitoring and adaptive management protocols should guide ongoing optimization. Annual environmental reporting encompassing greenhouse gas emissions, material recovery rates, air quality impacts, and economic performance metrics enables transparent accountability and identifies improvement priorities. Third-party verification of environmental claims enhances credibility and supports access to green financing mechanisms.
FAQ
What percentage of collected waste does the facility divert from landfills?
The Gaffey Street Safe Center achieves approximately 45%+ material recovery rates through sorting and processing operations. This diversion rate exceeds the Los Angeles County average and significantly surpasses conventional transfer station performance, though it remains below the most advanced facilities incorporating anaerobic digestion and specialized processing technologies.
How does the facility’s carbon footprint compare to landfilling the same waste?
The facility’s net carbon impact is negative—it prevents more emissions through material recovery and methane avoidance than it generates through operations. Organic waste processing alone avoids 200,000+ metric tons CO2e annually that would result from anaerobic decomposition in landfills. Material recovery displaces an additional 15,000-20,000 metric tons CO2e through avoided primary manufacturing.
What air quality impacts does the facility impose on surrounding communities?
The facility contributes to particulate matter and volatile organic compound concentrations in the San Pedro neighborhood, though quantifying precise attribution remains challenging given multiple regional pollution sources. The community receives approximately 200-300 odor complaints annually, indicating persistent management challenges. Air quality monitoring data and epidemiological research link chronic exposure to respiratory and cardiovascular health impacts.
How do facility operations align with California’s waste diversion targets?
California mandates 75% waste diversion by 2025, and facilities like Gaffey contribute substantially toward this goal through material recovery and waste processing. However, statewide diversion rates currently approximate 60%, suggesting additional infrastructure and policy support are necessary to achieve mandated targets. The facility’s 45%+ recovery rate, combined with partner facility processing of organic materials, contributes meaningfully to regional diversion performance.
What investments would further reduce the facility’s environmental impact?
Priority optimization pathways include advanced sorting technologies (cost: $8-15 million), on-site anaerobic digestion (cost: $12-18 million), renewable energy deployment (cost: $1.2-1.5 million), and heavy-duty vehicle electrification (cost: $16-30 million). Each investment offers distinct environmental benefits and financial returns, with selection depending on capital availability, market conditions, and strategic priorities.
How does environmental economics framework inform facility management?
Environmental economics perspectives emphasize internalizing externalities—converting unpriced environmental costs into operational decision factors. The facility’s environmental benefits (material recovery, emission avoidance) and costs (air quality, noise, traffic impacts) should guide investment prioritization and policy support. Mechanisms including carbon pricing, extended producer responsibility, and green procurement standards improve alignment between private facility economics and public environmental objectives.
What role do community benefit agreements play in addressing environmental justice concerns?
Community benefit agreements represent mechanisms for partial externality internalization, with facilities contributing resources to neighborhood improvement, health programs, and environmental monitoring. However, debate persists regarding whether voluntary measures adequately compensate for concentrated local burdens versus diffuse regional benefits. Participatory governance structures and health-based facility siting standards provide complementary approaches to environmental justice.